Quick Start Guide
In this quick start guide you will learn about barebench and its basic functionality. After finishing it, you will be able to to understand and modify the existing examples.
What is barebench?
barebench provides you with quick insights about the runtime of given functions on a certain embedded target. Traditionally, to accomplish this requires several time-consuming steps:
- Define the problem
- Define the function you are interested in.
- Define the conditions (parameters) for which the function should be evaluated.
- Provide the glue
- Integrate some form of timer or performance unit.
- Provide everything to allow your program to run (linker scripts, system startup, …).
- Compile everything for your embedded target.
- Use your hardware
- Flash the binary.
- Use debug or trace hardware to gather the results.
With barebench, you only have to define the problem. All other steps are handled automatically. You do not need debug/trace hardware, nor you need the embedded targets you want to test for.
Most importantly, there is no simulation involved to compute the results. All benchmarks are run on the chosen physical target.
Load an example
To make you familiar with the interface, we will start by loading an example project to experiment with.
- Click on your user in the top right menu.
- Select Load/Save project… and click Accumulate_Elements_STL-Native
View after the example is loaded.
- Click on Start Benchmark to run the example and display the results.
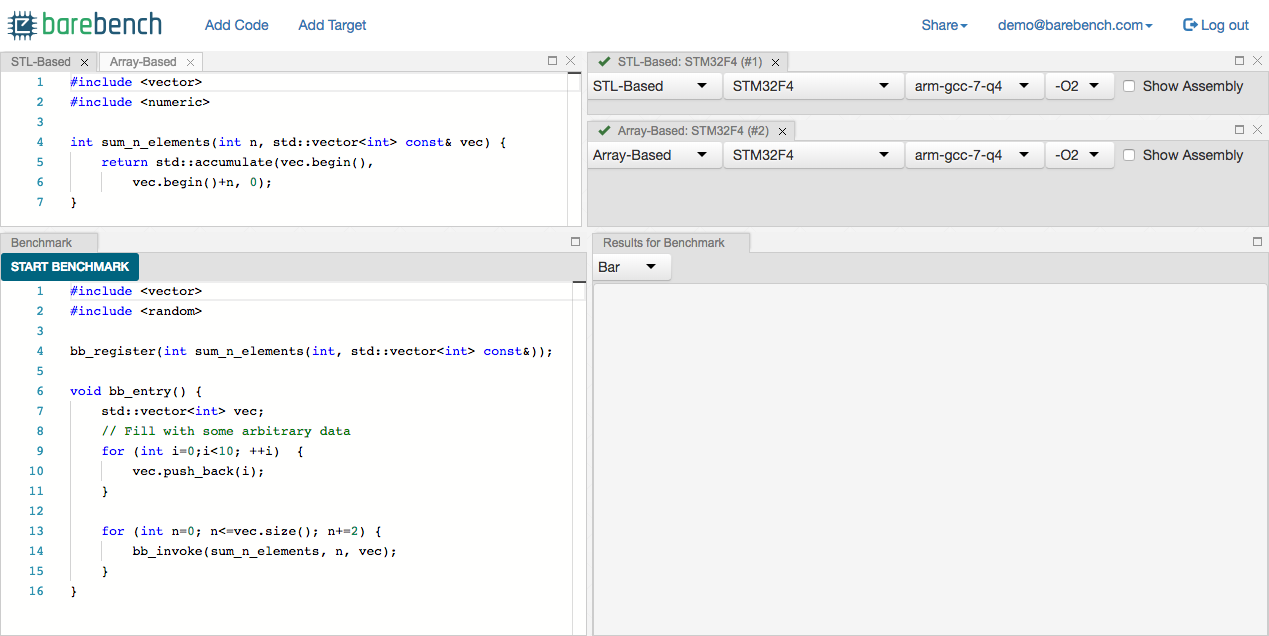
The interface
The view you see is separated into 4 major areas.
- The upper left code editor. Here you write down the function you want to benchmark. If you need to compare several versions of it, you get an additional editor by clicking on Add Code in the top menu.
- The top right configurations. Here you select on which target the selected code should be run and how it should get compiled. You get an additional configuration by clicking on Add Configuration in the top menu.
- The bottom left benchmark editor defines the parameters used to invoke the function defined in the code editor.
- The bottom right results view shows the clock cycles measured for each function call. This is done for each configuration with a different color.
The example explained
This example compares different implementations for a function to calculate the sum of a vectors elements.
int sum_n_elements(int n, std::vector<int> const& vec);
You see that there are 2 code editors open. One implements the function using a traditional for-loop approach. The other uses a STL algorithm to accomplish the same. Which one is faster?
To compare them, there is one configuration for each function. Both benchmarks are specified to run on the same target (STM32F4) using the same compiler and optimisation settings.
A look into the benchmark editor reveals how these functions will be called:
std::vector<int> vec;
// Fill with some arbitrary data
for (int i=0;i<10; ++i)  {
  vec.push_back(i);
}

for (int n=0; n<=vec.size(); n+=2) {
  bb_invoke(sum_n_elements, n, vec);
}
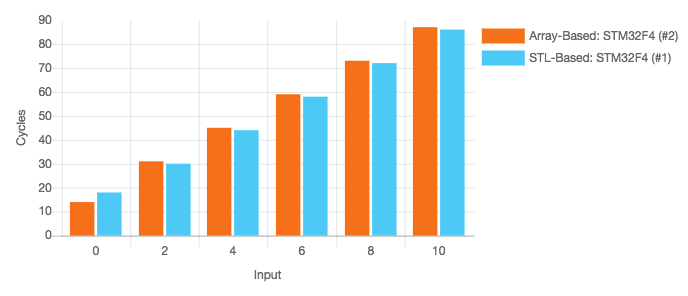
First a vector with 10 sample values is created. The bb_invoke is responsible for invoking the function with the given arguments and measuring its runtime. In this example, the function should be evaluated always for the same vector, with an input range (argument n) ranging from 0 to 10 and step size 2.
A click on Start Benchmark will run this same benchmark against the 2 implementations (given in the configuration). A look into the results reveals, that both functions require almost the same amount of cycles for each set of arguments.
This picture changes quite a bit, when you modify the configurations.
- Change the configuration to use no optimization (-O0) in both cases.
- Click Start Benchmark to rerun with the new configuration.
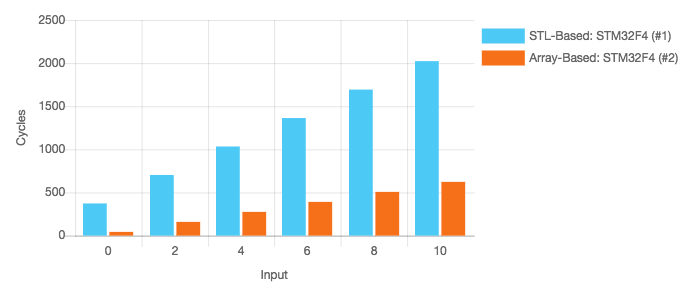
With no optimisation enabled, the STL-based version is slower by a factor of about 4.
Further steps
This guide showed you the basic functionality. We suggest you experiment a bit with the examples. You may then proceed to write your own benchmarks from scratch.