Analyzing results
The result view shows the measured runtime for each bb_invoke call. You can choose between three different modes:
- Line / Bar
- Displays the first function argument on the x-Axis and the cycle count (runtime) on the y-axis.
- Hover over a data point to see the return value.
- For more than one configuration, each argument-set contains the results for all individual configurations.
- Table
- Lists first function argument, cycle count and return value for each configuration.
- In case the return values between different configurations do not match, the corresponding row is highlighted.
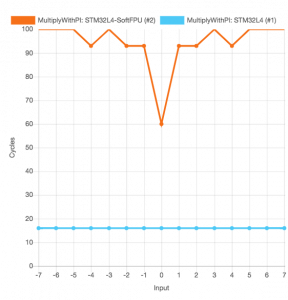
Line-mode
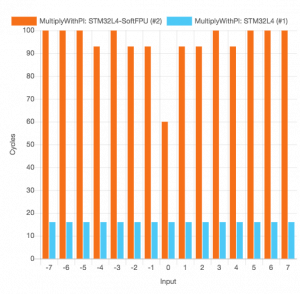
Bar-mode
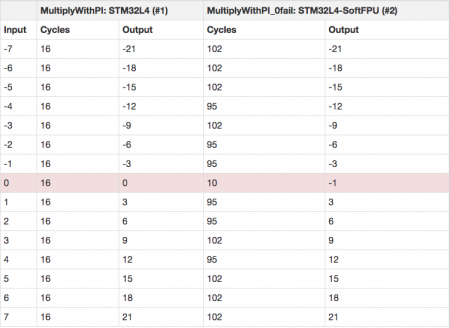
Table-mode with a mismatching implementation result for Input 0.